“It is the mark of a truly intelligent person to be moved by statistics” -George Bernard Shaw
Statistic is a fact shown in a numerical data. It can be useful for gathering, organizing, explaining, and conducting a research about a certain topic.
Statistics can also improve the readers in analyzing and thinking critically.Statistics can include correlation,cumulative frequency graph,as well as,box and whiskers.
What is “Correlation“?
Correlation is math's way of showing if two variables are strongly related. For example,normally shorter people are lighter than the taller ones.Therefore,we can say that height and weight are somehow related.
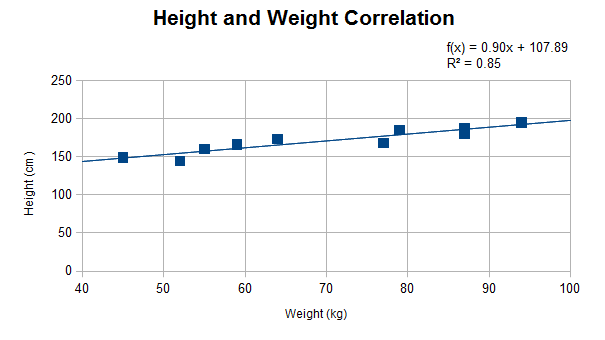
In this case,the height would be the independent variable,meanwhile the weight would be the dependent variable. Therefore,the equation of the line or more familiarly known as “equation of the regression line” is y = a + bx .
A equals to the Y Intercept
B equals to the gradient (rise over run)
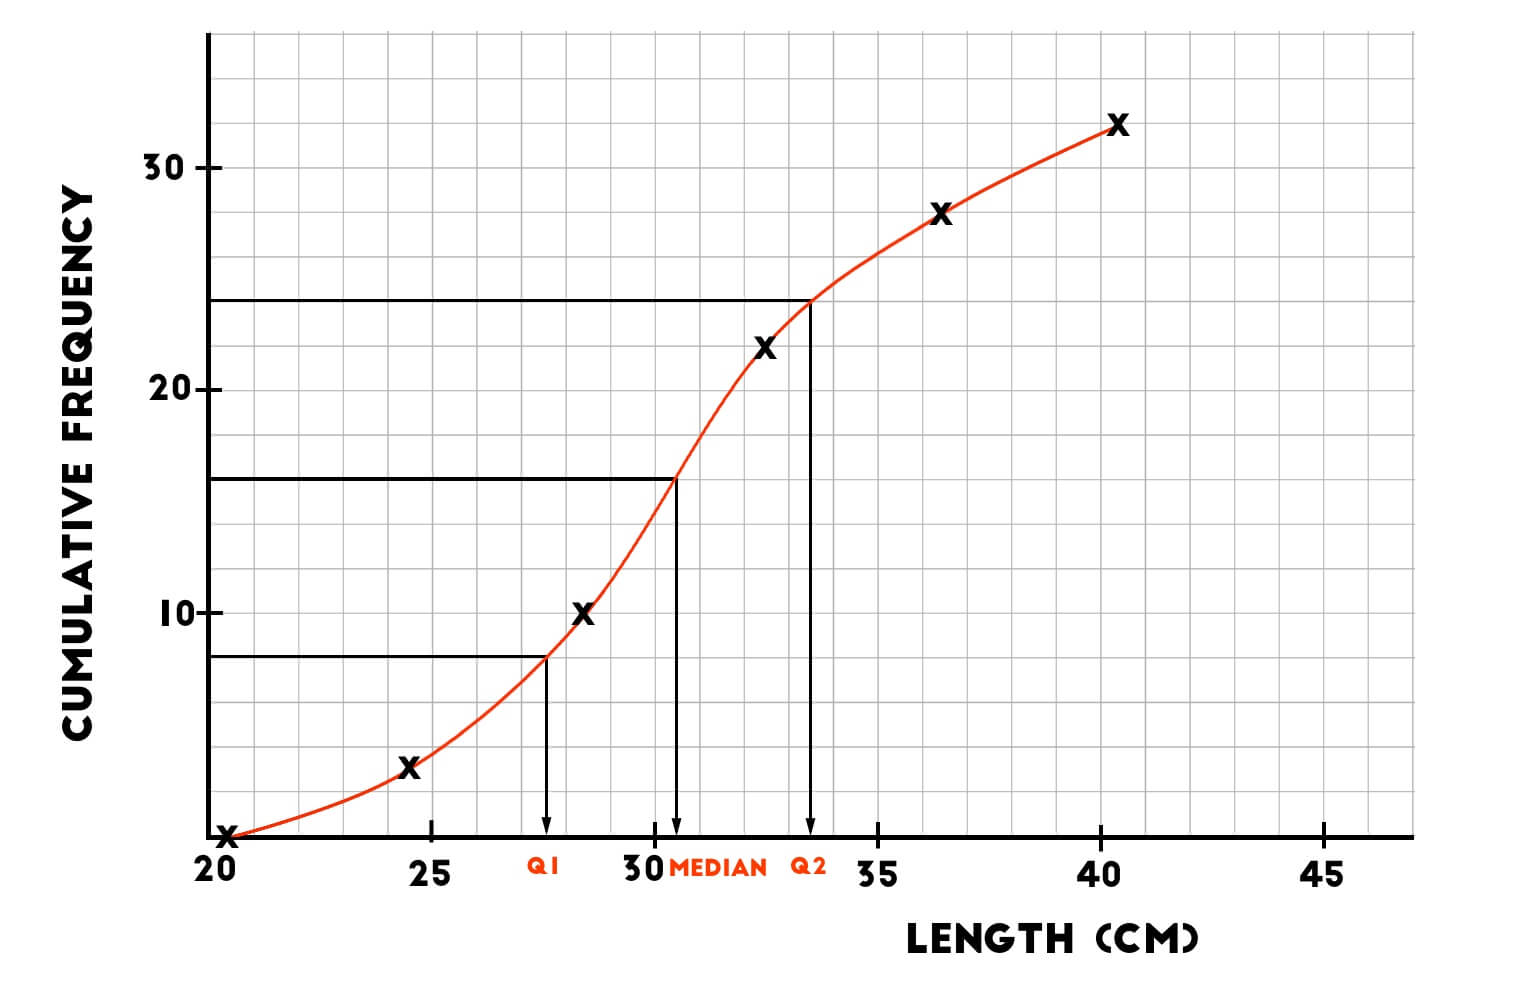
What is “Cumulative Frequency Graph“?
To know what exactly is cumulative frequency graph.We should know what cumulative frequency is first. Cumulative frequency is the total amount of frequency at that point.Technically, it is the 'running total' of frequencies. Therefore,cumulative frequency graph is where a straight line unite with the points marked on the graph.
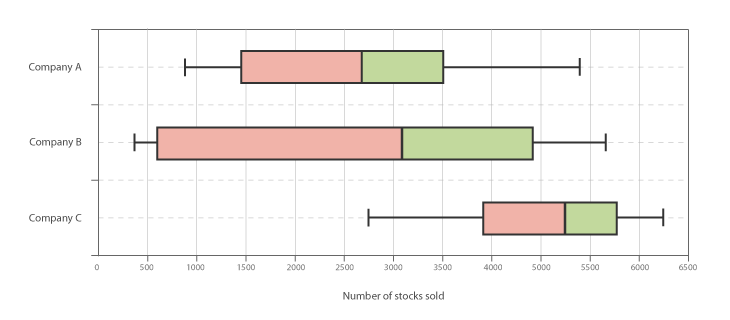
What is “Box and whiskers“?
The first quartile 1/4 * (n+1) can be represented as the first l ine of the box.
Box and whisker plot is an effective way visibly showing the data distribution through the quartiles. The lines that are outside of the 'box' are known as the 'whiskers'; which are used to indicate the minum and maximum amount based on the data itself.
The second quartile 1/2 (n+1) can be represented as the middle line of the box.
The third quartile 3/4* (n+1) can be represented as the last line of the box.
Everday use of statistics
Often, we underestimate the use of statistic without knowing that statistics creates a huge impact on our daily lives . Don't believe me? Well, these are some of the divisions where statistics are much needed:
1. Government Agencies
The people who works for the government often need statistics to make serious decisions about the education system, the amount of population, and healthcare services. They might make a research for checking the improvement of middle school students that are using a certain system or curriculum.
2.Medical field and Science area
Scientists and doctors can do a research about age, race, and nationality to know if these characteristics will affect one’s healthcare.This is useful so that they’ll know what kind of medicine works best for different people.
3.Large product manufacturing companies
The success of a business depends on knowing what product is high on demand and what is not.Usually,they have their own team that is conducting a research based on problems like the trending product,staffs,and customer services.

The blog shows a really brief yet great understanding of the topic. I like the organization of the information as it makes the concepts easier to read, as well as the varying information. It makes me remember the things I have studied in the past, along with all the details. The blog is useful for those who fail to align their mind into this particular topic.
LikeLike