Transformation and Matrices
“Mathematics is not about numbers, equations, computations, or algorithms; it is about understanding.”
-William Paul Thurston
What is “Transformations”?
Transformation is when the size or position of shape changes.
Shapes can be reflected, translated, and rotated.
The size of a shape can be decreased or increased based on the scale factor.
Reflection
First of all, we are going to discuss what a “reflection” is
In transformation, we can form another image or shape.
In reflection, a shape should be reflected across a line of reflection in order to form the newly created image.
Line of reflection can also be called as a mirror line.

Image of a shape being reflected
https://bam.files.bbci.co.uk/bam/live/content/zt6vgk7/large
Remember that in reflection, every point in the image should have an equal distance to the mirror line as the original shape.
To describe a shape’s reflection, the equation of the mirror line is needed.
For example: “ the line of reflection lies at x=3 or y=4”
Rotation
What is “rotation”?
Before we discuss what rotation is, it is important for us to know what is the
“center of rotation”, “angle of rotation”, and “the direction of rotation”.
This leads us to the next question : what are those?
Basically, the center of rotation is the point where the image will be rotated from. On the other hand, the angle of rotation is the measurement of the angle that will be rotated from the fixed point. Meanwhile, the direction of rotation is as simple as just the direction of the rotation.
note that the center of rotation doesn’t always have to be located in the origin (0,0) and that the distance from the center of rotation to the original shape must be the same distance to the newly created shape.
To do rotation, we can either use a compass or a tracing paper; both will do.
Based on what I learn (using tracing paper), these are the steps:
- Trace the shape to the transparent paper
- Make a line from the center of rotation to the shape drawn above.
- Rotate the paper to the wanted angle (90,180,270, or 360 degree)
Image of a shape being rotated

https://bam.files.bbci.co.uk/bam/live/content/zc47xnb/small

https://bam.files.bbci.co.uk/bam/live/content/zgrj2hv/small
Translation
What is translation?
| It is when you move a shape either from up to down or side to side but it doesn’t change how the shape looks like (the size of the shape) Translation is a part of transformation. In translation, all the points are translated in the same distance and direction. |

https://bam.files.bbci.co.uk/bam/live/content/z9kmtfr/small
Column vectors are used in translation, to describe the translation.

(-3)
This column vector indicates that the shape should move 4 units to the right and 3 units downwards.
Basically the one above represents X and it moves horizontally. Meanwhile, the one below represents Y and it moves vertically. If the number is positive in the X it moves to the right but it moves to the left if it is negative. On the other hand, if the number is positive in the Y it moves upwards but it moves downwards if it is negative.
Enlargement
What is “‘Enlargement’?
| It is when a shape is enlarged (made bigger or smaller). In enlargement, a scale factor and the center of enlargement is required. A positive scale factor will make the shape’s size bigger. Meanwhile, a negative scale factor will make the shape’s size smaller. The distance from the center of enlargement to each point of the shape should be multiplied to the scale factor to form the new shape. |


https://bam.files.bbci.co.uk/bam/live/content/zwjhsbk/large https://bam.files.bbci.co.uk/bam/live/content/zts487h/small
Matrices
So far we have learned how to add, subtract, and multiply a matrice.
Matrice is basically numbers that are put in brackets in a rectangular arrangement.
It is ordered by the number of rows to the number of columns.
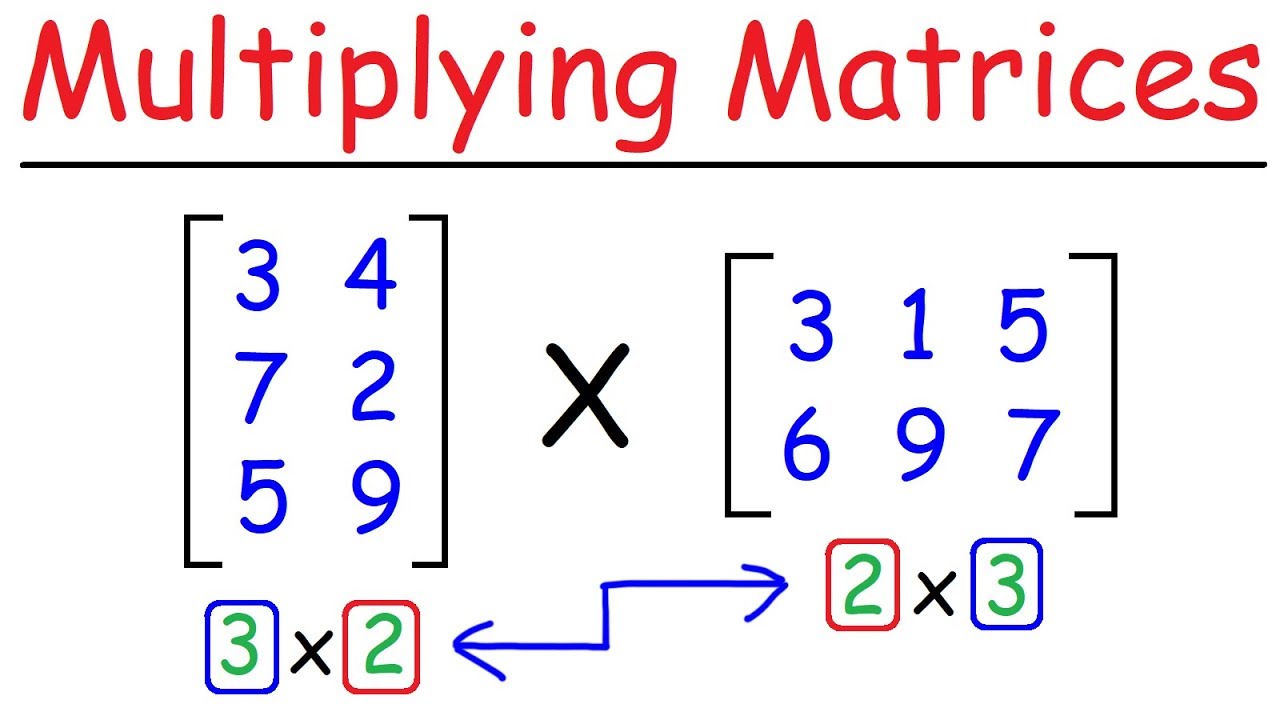
Adding and subtracting a matrices is done easily. The only rule is that the order of the matrices should be the same. However, if you want to multiply 2 matrices. Both of the matrices should be compatible. With this said, an example is if the first matrices have an order ( 2 x 3 ) and the second matrices have the order ( 3 x 2 ) it is possible to be multiplied; but if the first matrices is (1 x 3 ) and the second matrices is ( 3 x 1 ). Both of these matrices can’t be multiplied to each other. So do you see the relation?
In matrices, you need to know about identity matrices. Identity matrix is when the matrix is equal to the number 1.
The inverse of a matrix put in a formula can be known as:
X multiplied by X Inverse will be the I
note that I is known as identity matrix

We use the inverse of a matrix simply because we cannot divide in matrices.


Real-life applications:
- Productions of cars and a TV (Reflection)
- The wheel of a car turning (Rotation)
- Sewing a dress with the machine for sewing (Translation)
- Mapping a certain district or city (Enlargement)
